top of page

KSEF (Korea Science & Engineering Fair)
SmartEye: A Machine Learning Approach to Enhance Mobility for the Visually Impaired KESF 2025
through Depth Estimation and Object Detection

Camera glasses that spopt obstacles, gauge their distance and say it aloud - reaching past the white cane.
0.068
57.5
AbsRel depth error
mAP object
detection
Real-time
on an embedded
GPU board
Embedded board
Tested on real streets in Korea - class, confidence and estimated distance per object
01 Smart Eye
Every object gets a class and a distance
One shared backbone, two tasks: depth + detection


THE PROBLEM
A white cane protects only the space below the waist and within about a metre. It misses head- and knee-height obstacles; more than half of cane users report accidents, 36% a severe one. Guide dogs fill the gap for very few: about 20,000 work worldwide, each costs around $30,000 to train and serves 6–8 years. Commercial smart glasses run ₩2.7–7.8 million
FROM IMAGE TO SPEECH
A cane leaves the upper body unprotected (Bleau et al., 2021)
43.3M
people with vision
loss (2020)
~20,000
guide dogs
worldwide
$30,000
to train one guide
dog
KEY IDEA - GAUSSIAN-WEIGHTED DISTANCE
Input frame and its predicted depth map
1. A camera on the glasses captures the wearer's view.
2. One network returns objects and a depth map together.
3. A speaker says it: “pedestrian, 11 o'clock, 5 m.”
A plain average over the box mixes in background depth. A 2D Gaussian centred on the box lets the object's own pixels dominate.
Distance D = Gaussian-weighted mean of predicted depth
KITTI - 86k frames
ReDWeb - 3,600 everyday scenes with depth
RESULT
Depth error (AbsRel, lower is better)
Detection (mAP, higher is better)
SmartEye lands within 0.003 AbsRel and 3.4 mAP of the strongest models. Those transformer models are too slow and memory-hungry for an embedded board; SmartEye runs on it in real time.
TRAINING DATA
Pascal VOC - 20 object classes
81% class accuracy
ON THE STREET - WHAT'S NEXT
More field frames. Next: pixel-level segmentation, and fall detection that calls emergency services with GPS.
Quantitative Assessment of Eye Contact Performance in Autistic Children: KESF 2026
A machine Learning Model for Gaze Point Analysis from Eye Images in Eye Contact Video Training

02 Eye Images
A webcam-only system that scores eye-contact training for autistic children and screens gaze patterns for ASD.
8.3°
gaze angular error
−0.8°
vs. prior best (9.1°)
91.7%
ASD screening (pilot, n = 24)
Live gaze vector (pitch / yaw) from a laptop webcam
Score = share of gaze inside the eye box
Where it started
Same CNN, retrained easy → hard samples
Synthetic + real eye datasets
Gaze heatmap → ASD classifier
WHY EYE CONTACT
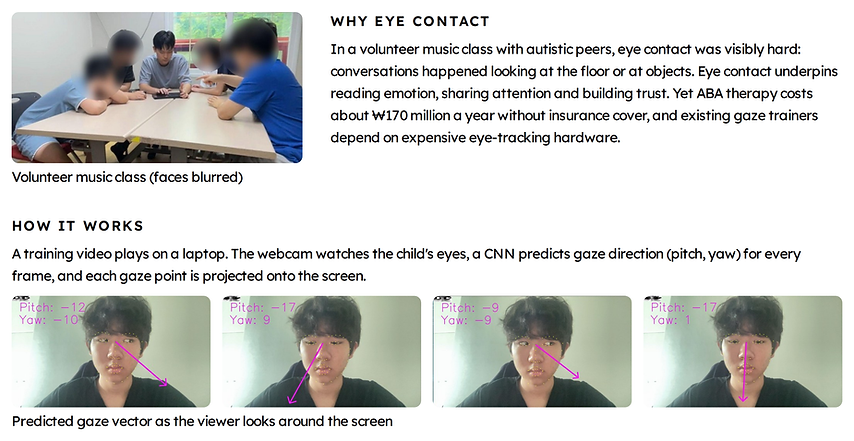
In a volunteer music class with autistic peers, eye contact was visibly hard: conversations happened looking at the floor or at objects. Eye contact underpins reading emotion, sharing attention and building trust. Yet ABA therapy costs about ₩170 million a year without insurance cover, and existing gaze trainers depend on expensive eye-tracking hardware.
Volunteer music class
HOW IT WORKS
A training video plays on a laptop. The webcam watches the child's eyes, a CNN predicts gaze direction (pitch, yaw) for every frame, and each gaze point is projected onto the screen.
Predicted gaze vector as the viewer looks around the screen

Yaw–pitch difference per sample
KEY IDEA - CHANGE THE ORDER, NOT THE NETWORK
Public eye datasets are sharp and clean; webcam input is not. Keeping the network untouched, training runs from easy samples (large yaw–pitch difference) to hard, ambiguous ones, with low-quality samples mixed in to close the gap to real use.
UnityEyes (200k synthetic) + MPIIGaze (214k real)
Bigger dot = longer look
Score = % of gaze on the eyes
Heatmap → CNN → ASD / control probability
RESULT
Test set: 11 of 12 correct
LIMITS & NEXT
A pilot with 12 children per group — a promising signal, not a diagnostic. Next: more participants, more varied videos and CNN designs.
FROM GAZE TO A SCORE - AND A SCREEN
0.8° better than the latest method, with identical data, settings and architecture.
bottom of page